

2014 Staten Island Real Estate Market Recap
Posted by Front Desk on
Another year over and we have the numbers to prove that it's only been getting better!
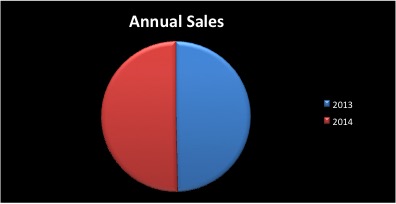
| Year | Sale Sides | Annual Volume | Avg Sale $ | Median Sold $ | Avg DOM |
|---|---|---|---|---|---|
| 2014 | 3783 | $1,501,243,653 | $396,839 | $380,000 | 130 |
Staten Island's 2014 real estate market ended with a phenominal 3,782 sale sides. As we've showed you before, there have been a few months where the market was slow, but compared to 2013 - the market has improved immensely with selling an additional 50+ homes.
| Year | Sale Sides | Annual Volume | Avg Sale $ | Median Sold $ | Avg DOM |
|---|---|---|---|---|---|
| 2013 | 3731 | $1,465,065,671 | $392,779 | $380,000 | 158 |
We can not stress it any more than we already have BUT - we are still in a seller's market! This is…
2166 Views, 0 Comments
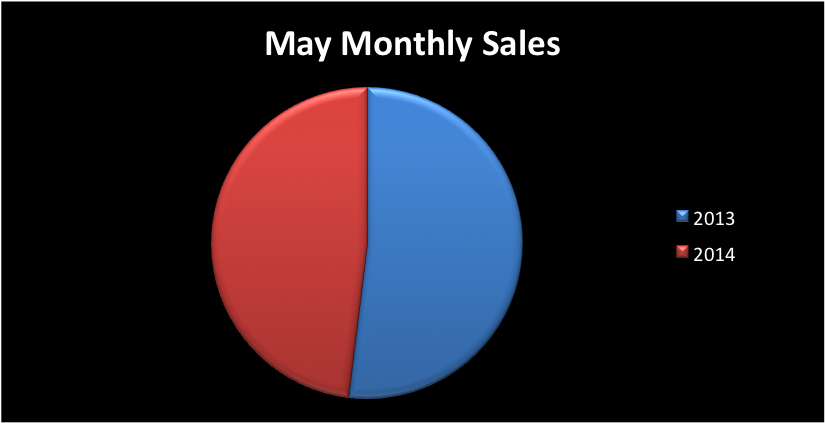 Last month, the Island had 248 sale sides with a monthly volume of $96,902,646. This differentiates to April 2013's 255 with a monthly volume of $101,895,194. There was an increase monthly sales from April 2014 to May 2014.
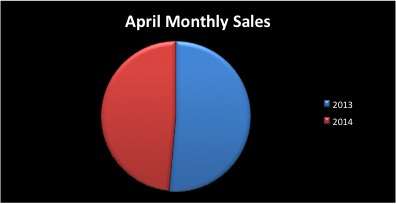 Last month, the Island had 241 sale sides with a monthly volume of $96,902,646. This differentiates to April 2013's 255 with a monthly volume of $100,133,380. There was an increase monthly sales from March 2014 to April 2014.
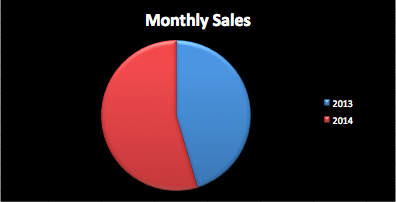 Last month, the Island had 239 sale sides with a monthly volume of $104,121,027. This differentiates to March 2013's 199 with a monthly volume of $88,413,037.