Tom Crimmins Realty is one of the top contenders on Staten Island. Our excellent seasoned agents provide remarkable customer service that help our numbers to grow.

It has been another year of big changes in Staten Island's real estate market. Here are the statistics that prove this!
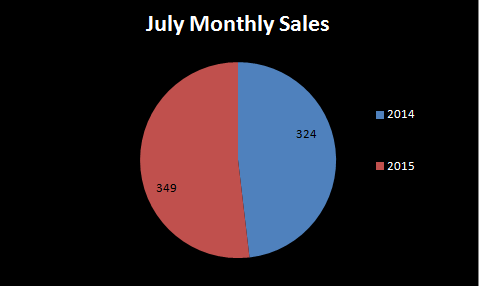
July 2014 monthly sales versus July 2015

In 2014, 324 properties were sold in the month of July. This year, homes sold in July increased to 349.


This chart shows that the average sale price of a house in Staten Island also had a healthy increase: from $447,357 in July of 2014 to $452,568 in July of 2015.

Month Year Monthly Sales Monthly Volume Avg Sale  Median Sold 
July 2014 324 $144,943,683 $447,357 $415,000
Month Year Monthly Sales Monthly Volume Avg Sale  Median Sold 
July 2015 349 $157,946,541 $452,568 $429,000

In conclusion, the real estate market has grown since July of…

1816 Views, 0 Comments

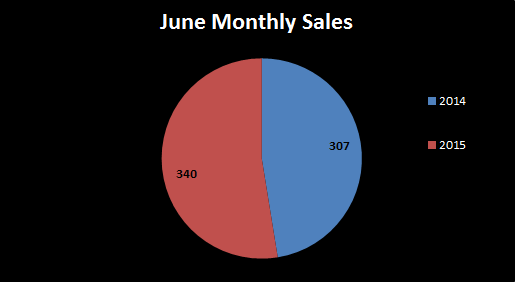
It has been another year, and much has changed in Staten Island's real estate market. Here are a few charts that show the changes that occurred between June of 2014 and June of this year.

The chart above shows that there has been a healthy increase in monthly sales. Last year, 307 properties were sold in the month of the July, compared to 340 this year.

This chart shows that there was a slight increase in the average sale price in Staten Island over the last year.

Month Year Monthly Sales Monthly Volume Avg Sale  Median Sold 
June 2014 307 $134,051,951 $436,651 $382,500
Month Year Monthly Sales Monthly Volume Avg Sale  Median Sold 
June 2015 340 $149,489,740 $439,675

1638 Views, 0 Comments

Another year over and we have the numbers to prove that it's only been getting better!

2014 Real Estate Market Sale Sides

Year Sale Sides Annual Volume Avg Sale $ Median Sold $ Avg DOM
2014 3783 $1,501,243,653 $396,839 $380,000 130

Staten Island's 2014 real estate market ended with a phenominal 3,782 sale sides. As we've showed you before, there have been a few months where the market was slow, but compared to 2013 - the market has improved immensely with selling an additional 50+ homes.

Year Sale Sides  Annual Volume Avg Sale $ Median Sold $ Avg DOM
2013 3731 $1,465,065,671 $392,779 $380,000 158

We can not stress it any more than we already have BUT - we are still in a seller's market! This is…

1784 Views, 0 Comments

The fall season has hit Staten Island real estate, and we put together the Island market recap from September 2014. 

September 2014 Real Estate Market Sale Sides

Month Year Monthly Sales Monthly Volume Avg Sale $ Median Sold $
September 2014 298 $130,616,573 $438,310 $401,014

The fall season started with 298 monthly sale in properties. Monthly volume on Staten Island increased from August 2014, although monthly sales decreased a bit from last month. Great Kills area had the highest number of sales in September, with a number of 31. Second, is Westerleigh who had 21 sale sides.

Staten Island kicks off the season with an average sale price of $438,310, which is a significant increase from August 2014's $417,303. 

Month Year Monthly Sales

1807 Views, 0 Comments

Home sales have substantially increased on Staten Island due to various factors. Buyer confidence is back, sellers are in acceptance for realistic asking prices, and historically low interest rates wrap up the formula of strengthened sales. 

"The key to real estate success in Staten Island, aside from having a seasonal professional staff," said Tom and Suzanne Crimmins, owners of Tom Crimmins Realty LTD.. "Is a well managed and maintained Internet website, aggressive Internet advertising, social media and good old school sale marketing."

Tom Crimmins Realty experienced a phenomenal year. Personal sales increased from 218 sale sides in 2012 to 386 in 2013. These numbers do not include their rentals or Brooklyn sales.

According to Tom Crimmins,…

2222 Views, 0 Comments