The Staten Island real estate market is changing. We keep track of the Island's sale sides, average listing price, etc.

Let's reflect on the up's and down's of the real estate market in the past ten years. These five points have made a massive impact today in the Staten Island real estate market:

Market Collapse & The Great Recession

In October 2007, the U.S. Secretary of the Treasury called the bursting housing bubble "the most significant risk to our economy," becoming a massive part of the Great Recession. Washington Mutual declared bankruptcy and the domino effect was larger than ever as housing prices dropped drastically. As a result - home values depreciated and homeowners lost their savings and investment, forcing millions of foreclosures.

Federal Takeover of Fannie and Freddie

Fannie Mae and Freddie Mac were taken control over by the federal government…

1386 Views, 0 Comments

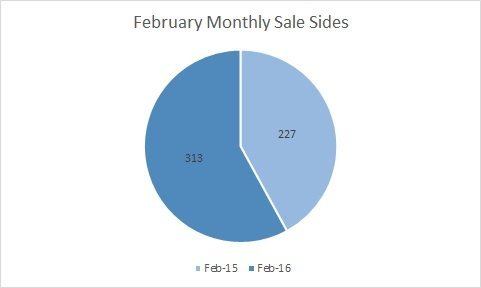
Staten Island real estate market is still going strong in the seller's market. Here are the statistics for February 2016 & 2015:

February 2016 Monthly Sale Sides

In 2015, 227 properties were sold in the month of February. This February, 313 homes were sold. The 86 sale side difference proves that although there has been more inventory, competition is still among buyers.


This chart shows that the average sale price of a house in Staten Island also had a healthy increase: from $442,895 in February of 2015 to $499,480 in February of 2016. There was also less days on the market for those sellers and buyers who are looking for a quick closing.

  Month     Year     Monthly Sales     Monthly Volume     Avg Sale     Median Sold     Avg DOM  
February 2015

1513 Views, 0 Comments

The debate between which is the better option- renting or buying - is always at work. The truth is that both choices have their own advantages, and their own disadvantages.

Thinking About Your Wallet

Many people, especially recent college graduates, decide to rent, thinking that it to be cheaper. However, is not necessarily true. Both Staten Island renting and buying a property come with their own costs. Buying a house is strenuous, as well as expensive -the hundreds of thousands of dollars can be intimidating. Because of this, people continue to rent for longer periods of time, and delay buying their own home.

Food for thought - home prices may be frightening and discouraging, but you never have to pay the entire amount upfront although down…

1423 Views, 0 Comments

Popularized in the 1950s, ranch homes gave us "cheap land and sprawling suburbs, with a horizontal footprint that turned its back on the streetscape to focus on backyard living."

There has been an increase in the sale of Staten Island ranch homes and here are some of the reasons why:

  • "People who want to have a one-story house are looking for [ranches] and buying, including boomers but also young families who don't want to be running up and down the stairs," said Alan Hess, author of the book "The Ranch House," who said there is a growing market for the homes in the resale market, even though their heyday was in the 1950s and 1960s. (x) Families with young children are drawn more to a one-level home to avoid the extra proofing of child-safety.

2511 Views, 0 Comments

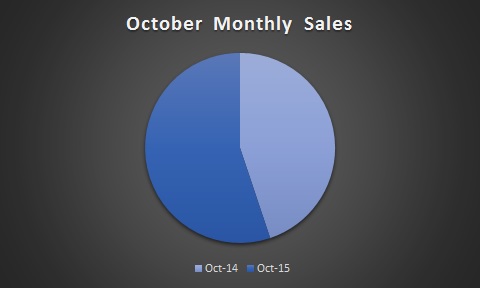
The ball is still in the seller's court and the real estate market is still increasing! Below are inventory reports for October 2014 and October 2015, as well as comparisons. 

October Staten Island Real Estate Market Sale Sides

Month Year Monthly Sales Monthly Volume Avg Sale $ Median Sold $
October 2015 419 $190,881,345 $455,564 $417,500

Comparing October 2015 to last year's month, Staten Island's real estate market had a healthy increase in sale sides from 341 to 419.

Month Year Monthly Sales Monthly Volume Avg Sale $ Median Sold $
October 2014 341 $149,270,693 $437,743 $420,000

The monthly sale sides and average sale price of October 2015 are a remarkable increase from last year's numbers.

Staten Island real…

1524 Views, 0 Comments

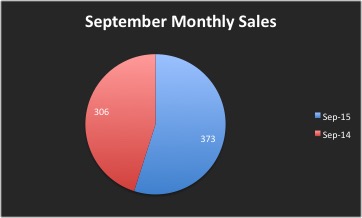
If you haven't read or heard before, now is the time to buy! Below are inventory reports for September 2014 and September 2015, as well as comparisons. It is evident that much has improve this past year.

September Staten Island Real Estate Market Sale Sides

Month Year Monthly Sales Monthly Volume Avg Sale $ Median Sold $
September 2015 373 $189,577,045 $508,249 $429,000

Comparing September 2015 to last year's month, Staten Island's real estate market had a healthy increase in sale sides from 306 to 373.

Month Year Monthly Sales Monthly Volume Avg Sale $ Median Sold $
September 2014 306 $136,374,073 $445,666 $403,264

The monthly and average sales of September 2015 has a remarkable increase from last year's numbers. 

1509 Views, 0 Comments

When a homeowner makes the decision to sell his or her property, it is most common for a skilled real estate professional to provide valuation services so that a reasonable asking price can be established. While the asking price may seem fair to the homeowner, the fact is that not all properties will sell at the original asking price. There are several instances when a homeowner may need to consider accepting a bid that is below the asking price.

When The Property Has Been On The Market For A While

Most homeowners will learn about the average listing time for similar properties in the market through their real estate agent, but some homes will remain on the market for longer than average. When this happens, a homeowner may begin to get concerned,…

1638 Views, 0 Comments

SIBOR says "if ever there was a year to list or purchase a home, wider economic factors seem to indicate that this is the one." With the change in weather and other factors - this can't be any more true.

New Listings in Staten Island increased 2.9%, pending Sales were up 33.8%. Inventory levels fell 22.5%.

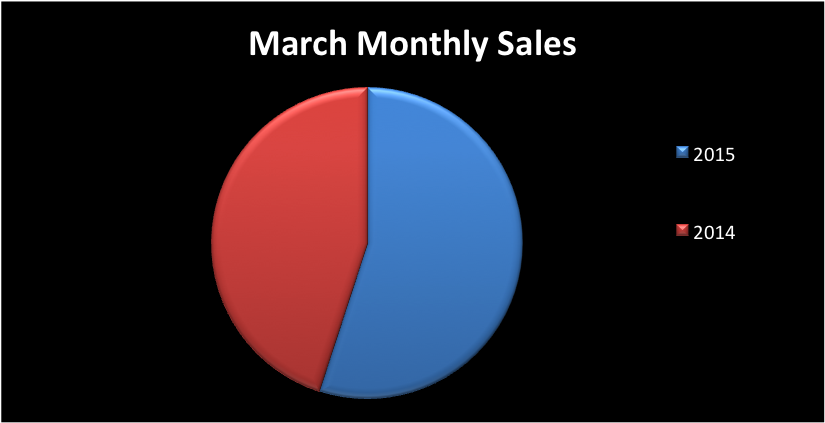
Spring is here and the real estate market is blossoming. Below are inventory reports for March 2014 and March 2015, as well as comparisons. 

March Staten Island Real Estate Market Sale Sides

Month Year Monthly Sales Monthly Volume Avg Sale $ Median Sold $
March 2015 297 $122,308,459 $411,812 $390,000

Comparing March 2015 to last year's month, Staten Island's real estate market had a healthy increase in sale sides from 243 to 297.

Month

1916 Views, 0 Comments

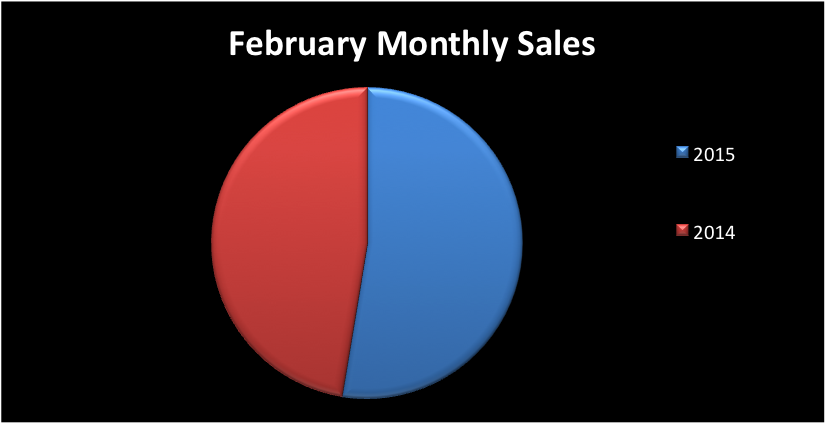
We have had a crazy winter this year and Staten Island real estate market shows that too! Below are inventory reports for February 2014 and February 2015, as well as comparisons. 

February Staten Island Real Estate Market Sale Sides

Month Year Monthly Sales Monthly Volume Avg Sale $ Median Sold $
February 2015 263 $100,588,338 $4382,465 $360,000

Comparing February 2015 to last year's month, Staten Island's real estate market had a healthy increase in sale sides from 237 to 263.

Month Year Monthly Sales Monthly Volume Avg Sale $ Median Sold $
February 2014 237 $92,547,224 $390,494 $365,650

February 2015 hit over $100,000,000 monthly volume - more evidence that Staten Island real estate market is picking up! 

1728 Views, 0 Comments

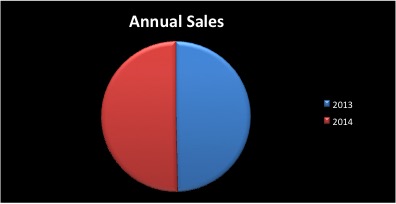
Another year over and we have the numbers to prove that it's only been getting better!

2014 Real Estate Market Sale Sides

Year Sale Sides Annual Volume Avg Sale $ Median Sold $ Avg DOM
2014 3783 $1,501,243,653 $396,839 $380,000 130

Staten Island's 2014 real estate market ended with a phenominal 3,782 sale sides. As we've showed you before, there have been a few months where the market was slow, but compared to 2013 - the market has improved immensely with selling an additional 50+ homes.

Year Sale Sides  Annual Volume Avg Sale $ Median Sold $ Avg DOM
2013 3731 $1,465,065,671 $392,779 $380,000 158

We can not stress it any more than we already have BUT - we are still in a seller's market! This is…

1794 Views, 0 Comments