Found 5 blog entries tagged as inventory.

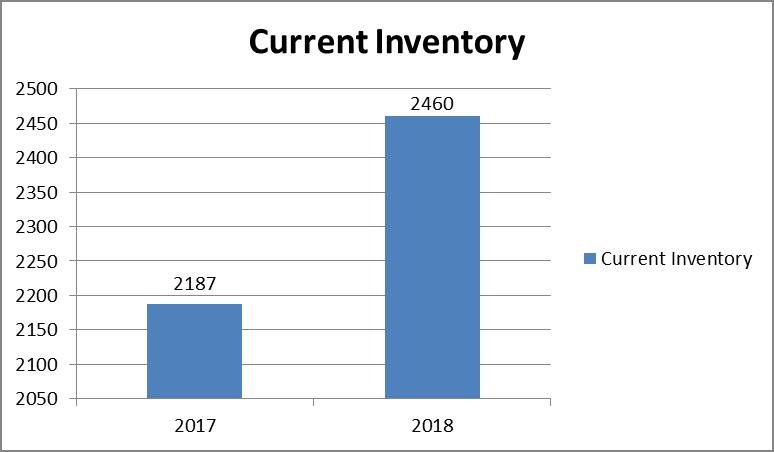
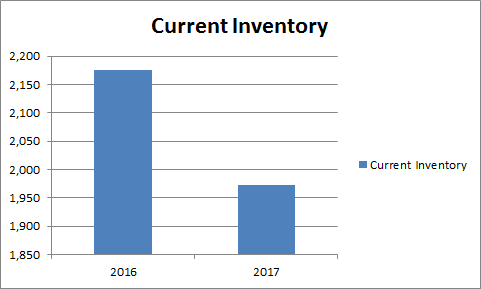
The Current Inventory numbers have increased from 2,286 houses in August 2017 to 2514 houses in August 2018. This increase lead to the decrease in the Average list price in 2018, as there is a larger market for buyers to choose from.

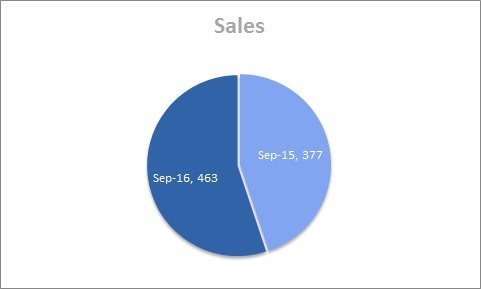
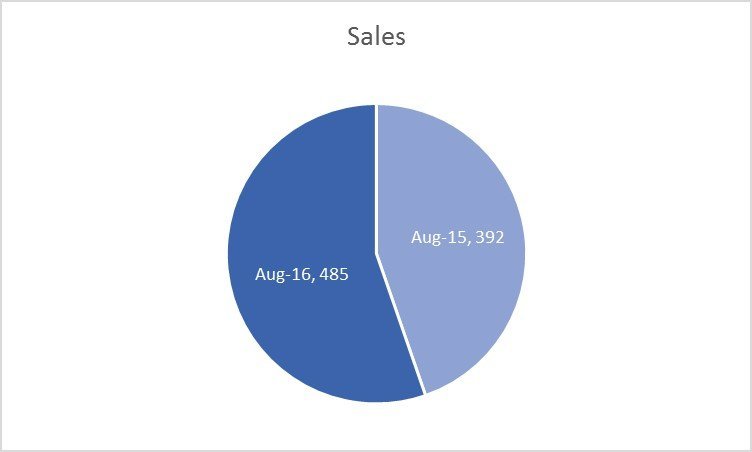
The chart above displays the total amount of sales that were made from August 2017 to August of 2018. This chart shows that 47 less homes were sold in August of this year, at least a 9.36% significant sale decrease compared to August of last year. 

The average sale price of homes has slightly decreased from $571,582 in August 2017 to $560,994 in August 2018. This was also caused by both the decrease in Days on Market and the increase in the Current Inventory, because the market has started to shift slowly from a sellers…

968 Views, 0 Comments

The Current Inventory numbers have increased from 2,187 houses in July 2017 to 2460 houses in July 2018. This increase lead to the increase in Average Days on Market in 2018, as there is a larger market for buyers to choose from.

The chart above displays the total amount of sales that were made from July 2017 to July of 2018. This chart shows that 52 more homes were sold in July of this year, at least a 13.97% significant sale increase compared to July of last year. 

The average listing price has increased from $558,127 in July 2017 to $626,488 in July 2018. This was caused by both the increase in Days on Market and the increase in the Current Inventory when compared to 2017.

The average sale price of homes has significantly…

939 Views, 0 Comments

The Current Inventory numbers have decreased from 2,176 houses in June 2016 to 1,973 houses in June 2017. This decrease lead to the increase in Average Listing Prices from 2016 to 2017.

The chart above displays the total amount of sales that were made from June 2016 to June of 2017. This chart shows that 37 more homes were sold in September of this year, at least a 9.7% significant sale increase compared to June of last year. 

The average listing price has increased from $511,306 in June 2016 to $570,394 in June 2017. This was caused by the decrease of Current Inventory numbers from 2016 to 2017.

The average sale price of homes has significantly increased from $489,078 in June 2016 to $551,884 in June 2017. This was also caused by…

1210 Views, 0 Comments

September Staten Island Real Estate Market Sale Sides

The chart above displays the total amount of sales that were made from September 2015 to September of 2016. This chart shows that 86 more homes were sold in September of this year, at least a 22.8% significant sale increase compared to September of last year. 

The average listing price has increased from $525,794 in September 2015 to $529,981 in September 2016. This was caused by the decrease of Current Inventory numbers from 2015 to 2016.

The average sale price of homes has significantly increased from $509,029 in September 2015 to $549,026 in September 2016. This was also caused by the decrease in Current Inventory.

The Average Days on Market (DoM) has decreased from 93 days in September of 2015 to 80 days in September of 2016.

1278 Views, 0 Comments

The chart above displays the total amount of sales that were made from August 2015 to August of 2016. This chart shows that 97 more homes were sold in August of this year, at least a 23.7% significant sale increase compared to August of last year. 

The average listing price has increased from $490,693 in August 2015 to $555,886 in August 2016. This was caused by the decrease of Current Inventory numbers from 2015 to 2016.

The average Days on Market (DOM) has decreased from 104 days in August 2015 to 88 days in August 2016.


The Current Inventory numbers have decreased from 2,626 houses in August 2015 to 1,976 houses in August 2016. This decrease lead to the increase in Average Listing Prices from 2015 to 2016.

In Conclusion,…

1426 Views, 0 Comments