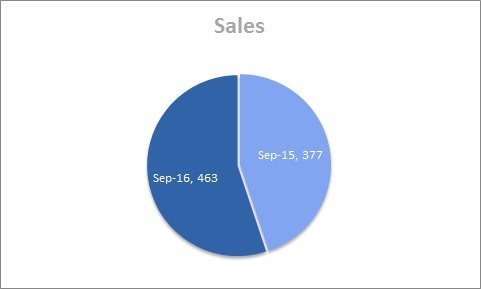
The chart above displays the total amount of sales that were made from September 2015 to September of 2016. This chart shows that 86 more homes were sold in September of this year, at least a 22.8% significant sale increase compared to September of last year.

The average listing price has increased from $525,794 in September 2015 to $529,981 in September 2016. This was caused by the decrease of Current Inventory numbers from 2015 to 2016.

The average sale price of homes has significantly increased from $509,029 in September 2015 to $549,026 in September 2016. This was also caused by the decrease in Current Inventory.

The Average Days on Market (DoM) has decreased from 93 days in September of 2015 to 80 days in September of 2016.
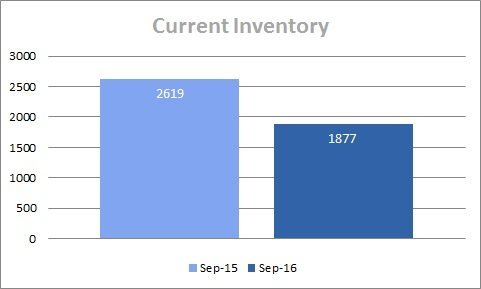
The Current Inventory numbers have decreased from 2,619 houses in September 2015 to 1,877 houses in September 2016. This decrease lead to the increase in Average Listing Prices from 2015 to 2016.
In Conclusion, because there is less inventory, homes are spending less time on the market, and they are selling for on average roughly $40,000 more than compared to last years. With the inventory stock down, competition among buyers continues to rise, and the market continues to grow, making now an excellent time to move to Staten Island. If you are looking to find out the value of your home: http://statenisland.freehousevalues.com/
Posted by Tom Crimmins Realty on
Leave A Comment