Found 8 blog entries tagged as staten island market.

Staten Island real estate market is still going strong in the seller's market. There may be fewer homes, but sales are higher than ever! Here are the statistics for November 2016 & 2015:
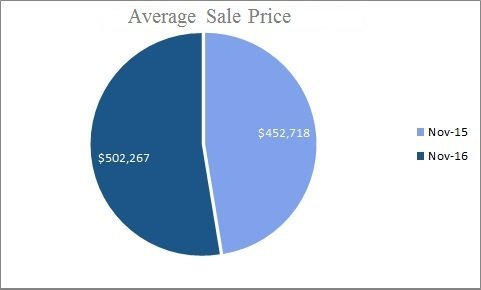
The chart above displays an average sale price increase of $50,000 for November 2016, an 11.04% increase compared to November 2015. This is most likely caused by the decrease in inventory as shown below.

With the decrease in inventory as displayed above, the average listing and sale price for November 2016 have increased substantially and cut time spent on the market by approximately 20%.

As shown above, the time spent on market has decreased and the number of monthly sales has increased.

In Conclusion, because there is less inventory, homes are…

1087 Views, 0 Comments

Based off of the U.S. Census, here are some Staten Island statistics that relate to the Staten Island real estate market.

Area with the most multi-family housing:

The 10301 Zip Code has the most multi-family housing, including developments along the St. George and Stapleton waterfront. Only 10 percent of the homes in 10301 are single-family, detached, owner-occupied homes.

The borough's most diverse neighborhoods:

Some of the borough's most diverse neighborhoods are found in the 10304 Zip Code. More than a quarter of the residents in Stapleton, Clifton, Concord and Rosebank speak a language other than English at home, with Spanish, Italian, Chinese and Russian topping the list.

Area with the largest number of single-family homes: 

The…

1844 Views, 0 Comments

Staten Island real estate market is still going strong in the seller's market. Here are the statistics for February 2016 & 2015:

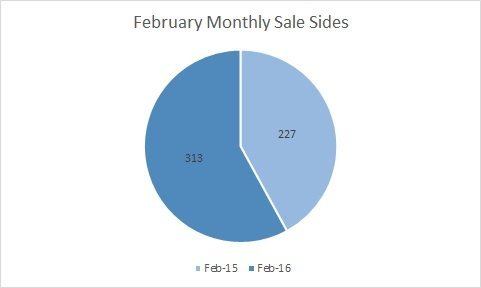
February 2016 Monthly Sale Sides

In 2015, 227 properties were sold in the month of February. This February, 313 homes were sold. The 86 sale side difference proves that although there has been more inventory, competition is still among buyers.


This chart shows that the average sale price of a house in Staten Island also had a healthy increase: from $442,895 in February of 2015 to $499,480 in February of 2016. There was also less days on the market for those sellers and buyers who are looking for a quick closing.

  Month     Year     Monthly Sales     Monthly Volume     Avg Sale     Median Sold     Avg DOM  
February 2015

1510 Views, 0 Comments

The ball is still in the seller's court and the real estate market is still increasing! Below are inventory reports for October 2014 and October 2015, as well as comparisons. 

October Staten Island Real Estate Market Sale Sides

Month Year Monthly Sales Monthly Volume Avg Sale $ Median Sold $
October 2015 419 $190,881,345 $455,564 $417,500

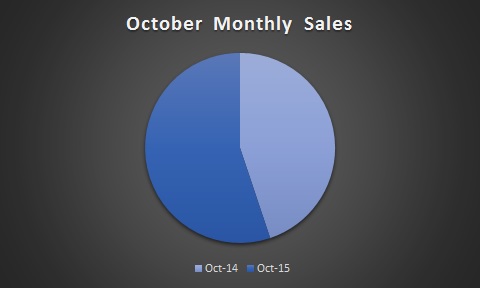
Comparing October 2015 to last year's month, Staten Island's real estate market had a healthy increase in sale sides from 341 to 419.

Month Year Monthly Sales Monthly Volume Avg Sale $ Median Sold $
October 2014 341 $149,270,693 $437,743 $420,000

The monthly sale sides and average sale price of October 2015 are a remarkable increase from last year's numbers.

Staten Island real…

1523 Views, 0 Comments

SIBOR says "if ever there was a year to list or purchase a home, wider economic factors seem to indicate that this is the one." With the change in weather and other factors - this can't be any more true.

New Listings in Staten Island increased 2.9%, pending Sales were up 33.8%. Inventory levels fell 22.5%.

Spring is here and the real estate market is blossoming. Below are inventory reports for March 2014 and March 2015, as well as comparisons. 

March Staten Island Real Estate Market Sale Sides

Month Year Monthly Sales Monthly Volume Avg Sale $ Median Sold $
March 2015 297 $122,308,459 $411,812 $390,000

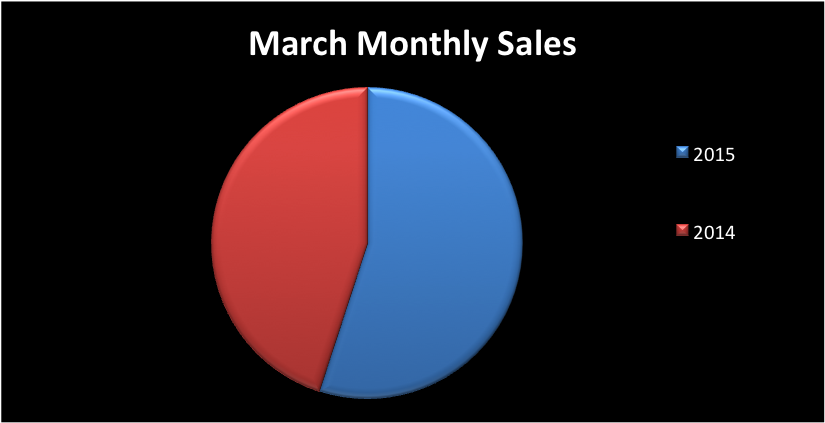
Comparing March 2015 to last year's month, Staten Island's real estate market had a healthy increase in sale sides from 243 to 297.

Month

1913 Views, 0 Comments

Staten Island's real estate market is still on the upside. April 2014 had a sight monthly sales decrease but increase in average sale price in camparison to April 2013.

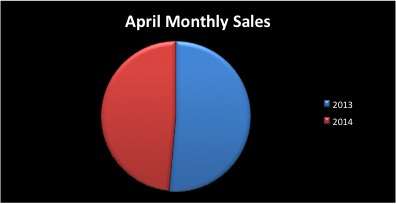
Staten Island April 2014 Real EstateLast month, the Island had 241 sale sides with a monthly volume of $96,902,646. This differentiates to April 2013's 255 with a monthly volume of $100,133,380. There was an increase monthly sales from March 2014 to April 2014. 
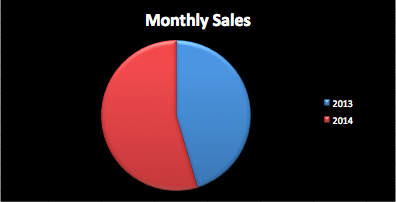
Month Year Monthly Sales Monthly Volume Avg List $ Avg Sale $ Median Sold $ Avg DOM
April 2014 241 $96,902,646 $426,255 $402,085 $375,000 135

Staten Island wrapped April up with an average sale price of $426,255. This is a small increase from the $422,374 that was raked in April. There was also an improvement of…

2206 Views, 0 Comments

Staten Island's real estate market is still on the upside. March had a small sale side decrease in average sale prices, however, an increase in monthly sales compared to last year's month.

Staten Island February 2014 Real EstateLast month, the Island had 239 sale sides with a monthly volume of $104,121,027. This differentiates to March 2013's 199 with a monthly volume of $88,413,037. 
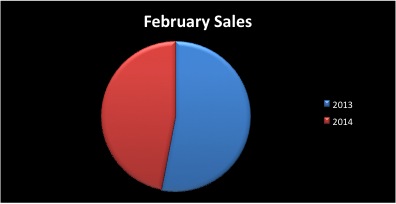
Month Year Monthly Sales Monthly Volume Avg List $ Avg Sale $ Median Sold $ Avg DOM
March 2014 239 $104,121,027 $435,652 $413,916 $378,000 162

Staten Island wrapped March up with an average sale price of $435,652. This is a slight decrease from the $444,286 that was raked in March of last year. 

Month Year Monthly Sales Monthly Volume Avg List $

2095 Views, 0 Comments

Staten Island's real estate market is still on the upside. February had a small sale side decrease compared to last year's month.

Staten Island February 2014 Real EstateLast month, the Island had 209 sale sides with a monthly volume of $91,393,599. This differentiates to February 2013's 236 with a monthly volume of $91,187,983. 

Month Year Monthly Sales Monthly Volume Avg List $ Avg Sale $ Median Sold $ Avg DOM
February 2014 209 $91,393,599 $465,820 $437,289 $410,000 127

Staten Island wrapped January up with an average sale price of $437,289. This is a significant increase from the $386,389 that was raked in in February 2013. 

Month Year Monthly Sales Monthly Volume Avg List $ Avg Sale $ Median Sold $ Avg DOM
February

1849 Views, 0 Comments