August 2016 Staten Island Real Estate Market Recap
Posted by Tom Crimmins Realty on

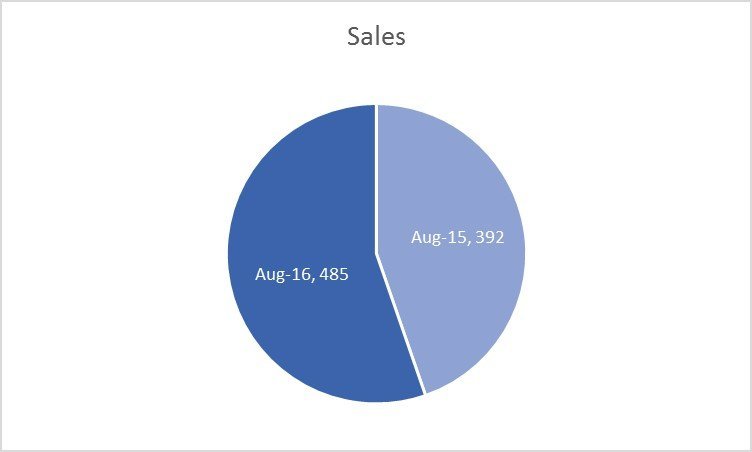
The chart above displays the total amount of sales that were made from August 2015 to August of 2016. This chart shows that 97 more homes were sold in August of this year, at least a 23.7% significant sale increase compared to August of last year.
The average listing price has increased from $490,693 in August 2015 to $555,886 in August 2016. This was caused by the decrease of Current Inventory numbers from 2015 to 2016.
The average Days on Market (DOM) has decreased from 104 days in August 2015 to 88 days in August 2016.
The Current Inventory numbers have decreased from 2,626 houses in August 2015 to 1,976 houses in August 2016. This decrease lead to the increase in Average Listing Prices from 2015 to 2016.
In Conclusion,…
1425 Views, 0 Comments


