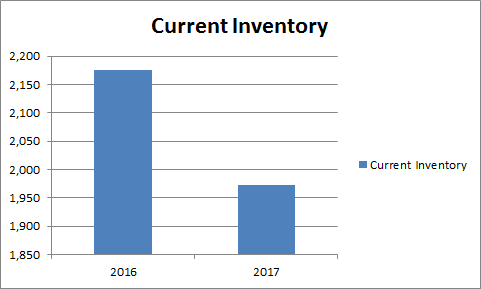
The Current Inventory numbers have decreased from 2,176 houses in June 2016 to 1,973 houses in June 2017. This decrease lead to the increase in Average Listing Prices from 2016 to 2017.
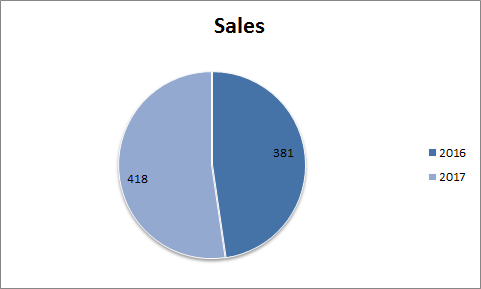
The chart above displays the total amount of sales that were made from June 2016 to June of 2017. This chart shows that 37 more homes were sold in September of this year, at least a 9.7% significant sale increase compared to June of last year.
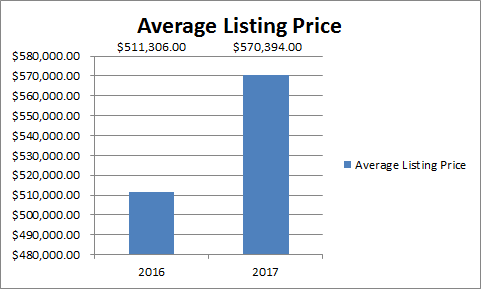
The average listing price has increased from $511,306 in June 2016 to $570,394 in June 2017. This was caused by the decrease of Current Inventory numbers from 2016 to 2017.
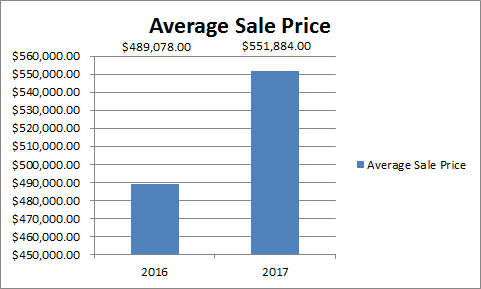
The average sale price of homes has significantly increased from $489,078 in June 2016 to $551,884 in June 2017. This was also caused by the decrease in Current Inventory.
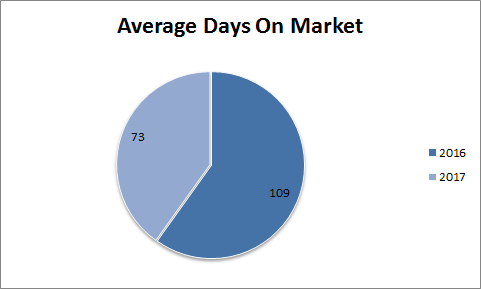
The Average Days on Market (DoM) has shown a significant decrease from 109 days in June of 2016 to 73 days in June of 2017.
In Conclusion, because there is less inventory, homes are spending less time on the market, and they are selling for on average roughly $63,000 more than compared to last years. With the inventory stock down, competition among buyers continues to rise, and the market continues to grow, making now an excellent time to sell on Staten Island, especially if you are an investor. If you are looking to find out the value of your home: http://statenisland.freehousevalues.com/. If you are a buyer, don't be disheartened about buying your dream home. We here at Tom Crimmins Realty are willing to work hand in hand with you, getting you the best price for the home of your dreams!
Leave A Comment